最近 Elon 又在 Twitter 玩起了骚操作,先是禁止未登录用户访问,然后是限制已登录用户每天查看推文的数量。个中原因这里不去猜测(有一些看起来很靠谱的推测 ),但不论怎样,Twitter 越来越呈现一副💊的模样。
这不禁让我回顾自己的社交网络使用历史。我高强度持续(>4 年,几乎天天用)使用过的平台有三个:校内/人人网 --> 知乎 --> Twitter,偶尔会刷刷 Reddit。不知为什么,这些平台要么已经死掉,要么就是在以肉眼可见的速度滑落。鉴于这些都不是小众平台,“正在用的社交网络劣化了”应该符合很多人的体验。
问题是,为什么会这样?如果审视每个平台倒塌的原因,似乎各有不同:
人人网:陈一舟不行、产品策略失当、移动端转型失败、微信/微博崛起
知乎:盈利模式不清晰、监管和大环境限制、运营不当逼走有价值的用户
Twitter:Elon Musk,但 Elon 自己说 Twitter 烧钱速度太快,所以我们姑且认为营收不利是另一个原因
Reddit:上市的压力导致管理层错误决策
但综合来看,似乎可以认为社交网络“不赚钱”的特性才是根源。这是合理的推测:社交网络需要用户量,搞全员付费&订阅不现实;于是唯一的赚钱方式就是广告,然而广告和用户体验又是相悖的。平台既要又要,导致了各种骚操作——这些操作看起来不同,但根本原因是类似的(人人网可能是唯一一个特例)。
如果认同这个理论,似乎社交网络便成为了一个死局。然而,如果把目光投向 Instagram、Mastodon,似乎又不是这样。我觉得,长期成功且普及(用户 > 亿)的社交平台可能只会有两种:
a. 由真正懂社交网络的巨头控制,现阶段只有 Meta
b. 不以 资本 盈利为目标
SocialFi 及其它基于 Web 3 的平台,我不够了解就不做评论了。
最后一点看法:现在趋势是协议为先,强调去中心化,比如 Bluesky 和 Nostr。作为开发者,这些理念令人欣喜,但我完全不认为它们对产品成功有决定性的帮助。当然,我希望它们成功,至少能有朝一日威胁到 Twitter 和 Meta。
在 2023 年这个时间点,我看不出有什么继续使用豆瓣标注 功能的理由(社交功能另说)。NeoDB 在各方面都优于豆瓣。
无审查 。最直接也是最重要的原因。豆瓣被删去的条目太多了,比如最近大火的《人选之人:造浪者》 。没有人想读了一堆书看了一堆电影,结果标记不上吧。数据来源更丰富 。比如 NeoDB 可以标记播客,未来还会支持更多 豆瓣没有的条目类型。
代码 和 roadmap 都开源
社区友好 。GitHub Issues 回得快修得快,还有 Discord 社群。你知道怎么向豆瓣提反馈吗?反馈了会听吗?
无痛迁移 。可以直接从豆瓣把数据导入 NeoDB,参考 NeoDB使用指南 。
使用 NeoDB 并不需要你使用 mastodon,只需要你有一个账号。所以即使你不用 mastodon,也完全不影响使用 NeoDB。
豆瓣就像一艘沉船,如果你还在用,NeoDB 大概会是你的救生艇。
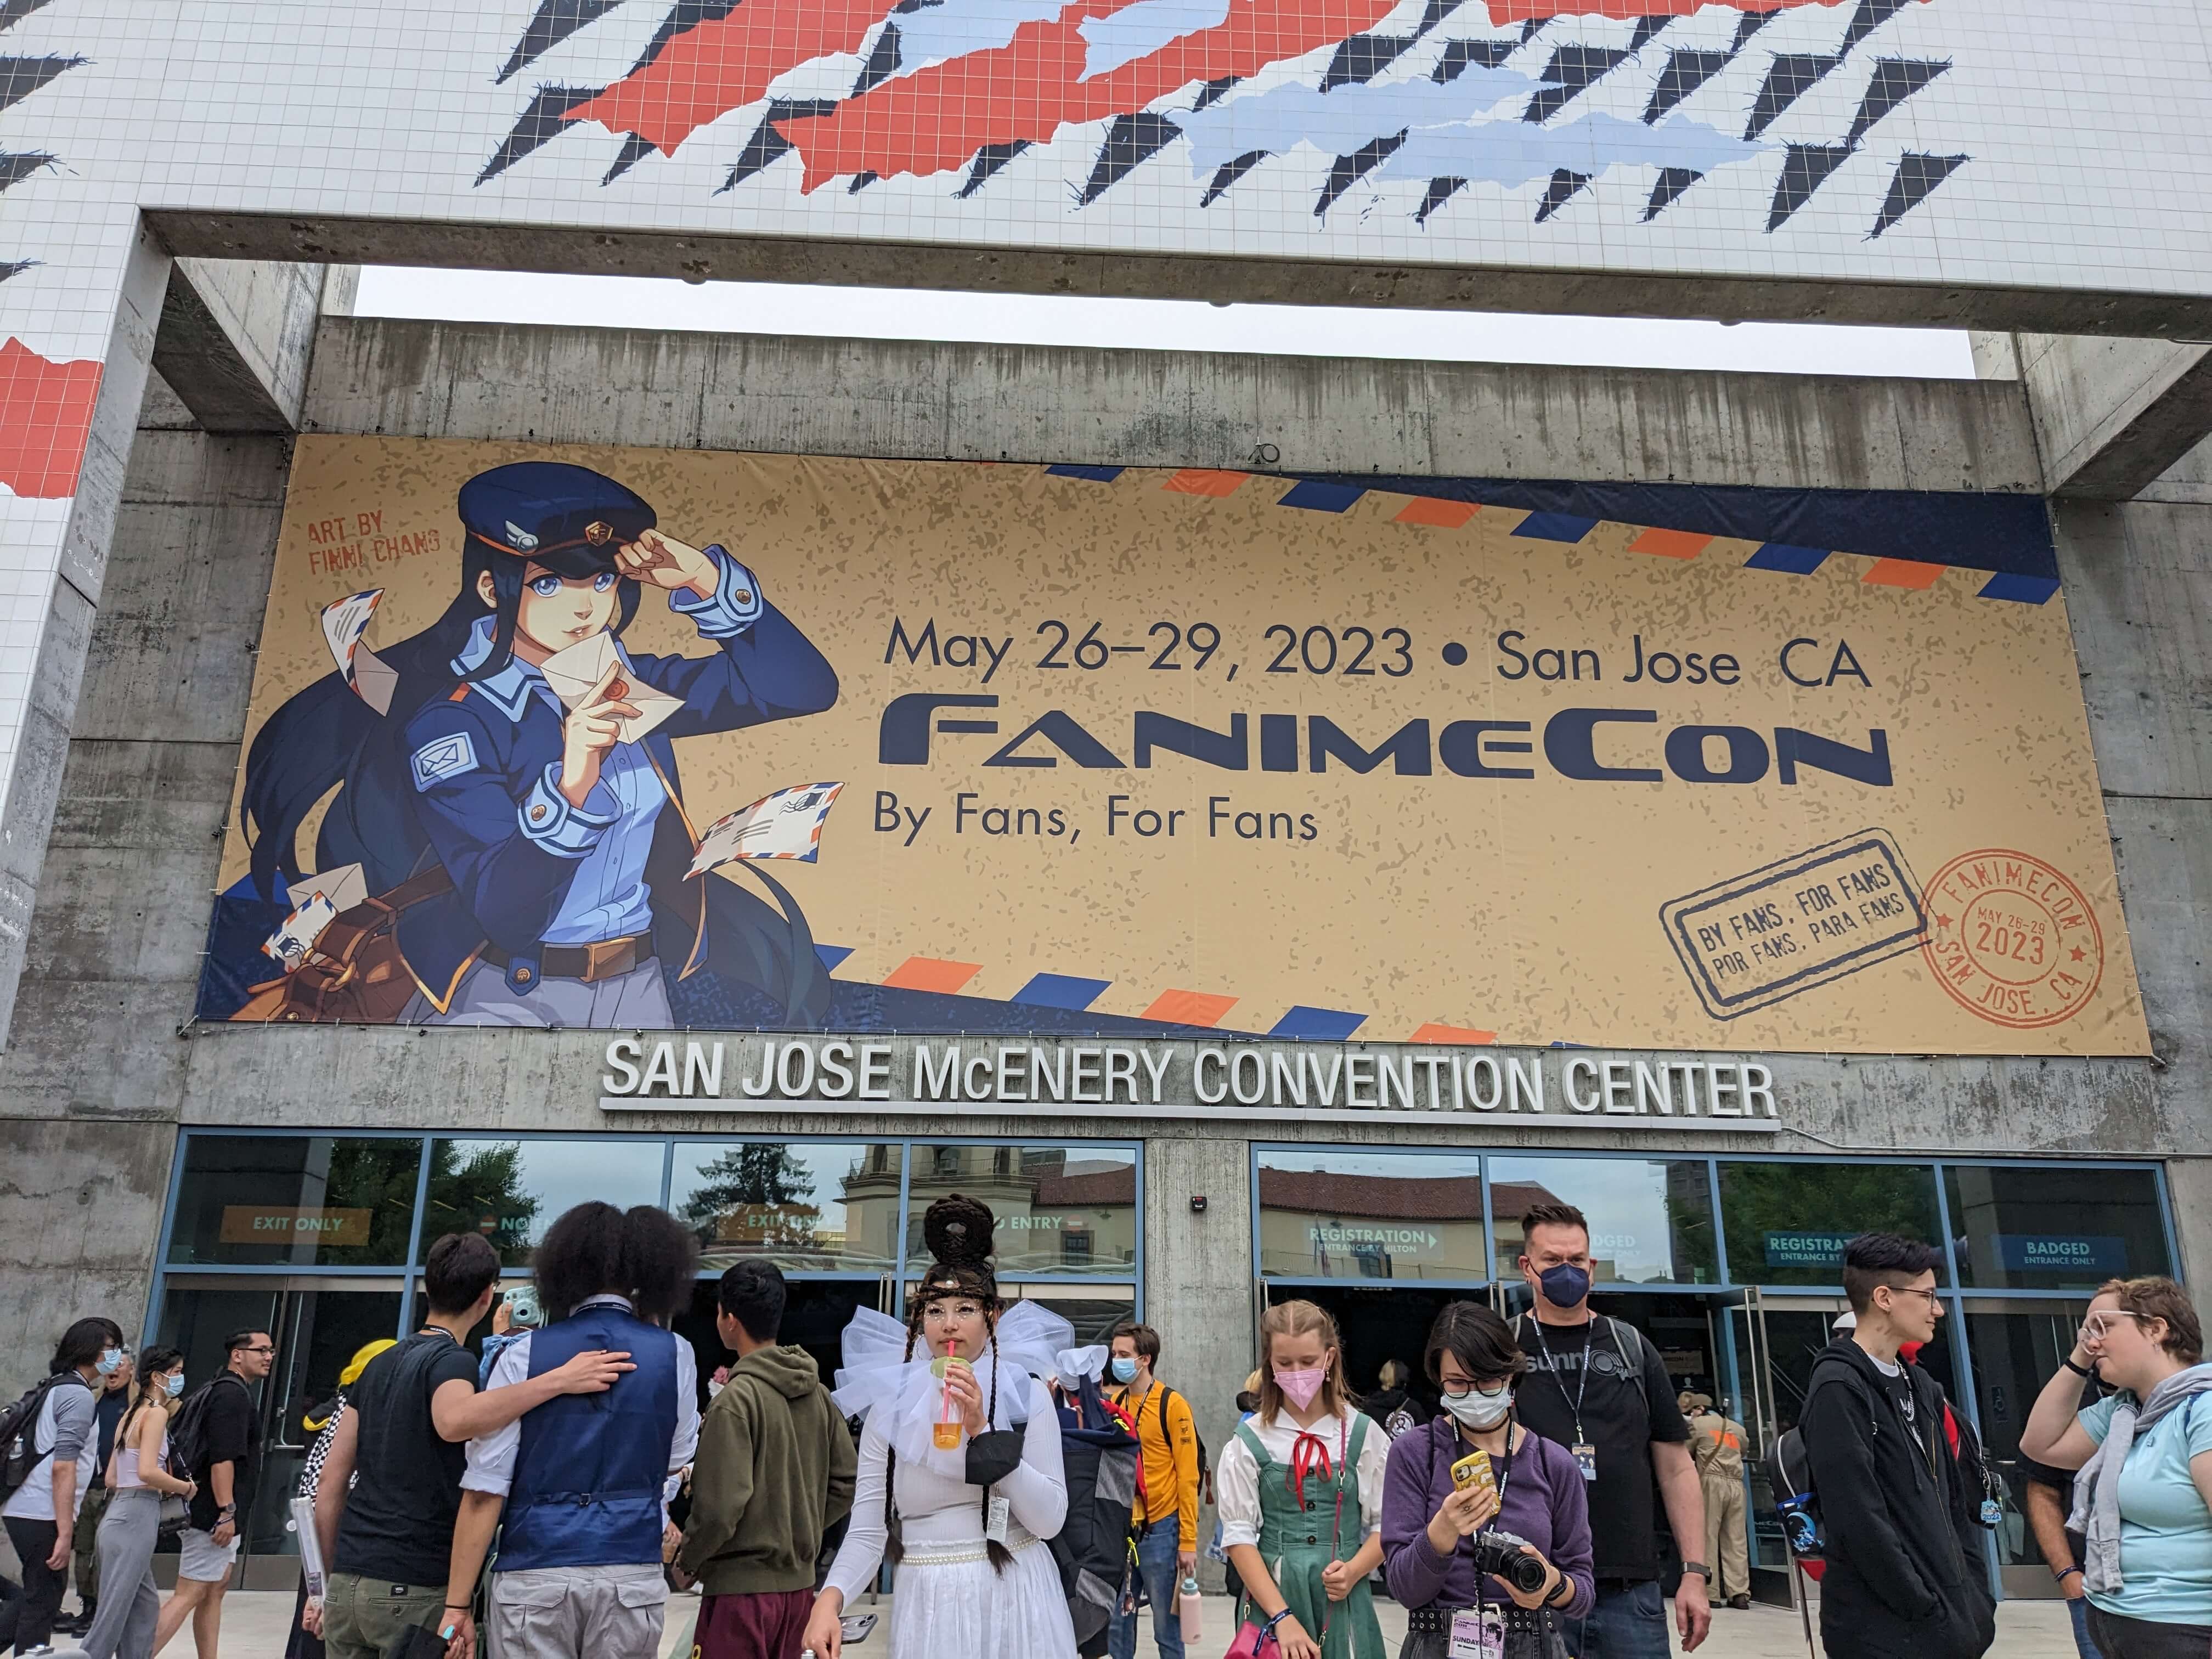
这两天去了 FanimeCon 。第一次参加美国漫展有不少新鲜的体验,趁记忆还热乎记录一下:
之前印象流,以为美国漫展主要都是漫威DC啥的。FanimeCon 完全颠覆了这个印象:我几乎看不到任何美漫角色的 cos 和周边,全是你能想到的那些新番+热门民工漫,还有原神。题材而言,和国内漫展没有任何区别。
原因为何?或许 FanimeCon 传统上更偏向日本 ACG,但我觉得更可能是 Crunchyroll, Netflix 等流媒体的发展打破了国家和语言壁垒,让美国观众得以同步观看新番,因此观众数量大爆发。Gigguk 以前探讨过这个现象,说现在追番的潮流太吓人,观众都仿佛 FOMO(fear of missing out)一样只看当季新番,反而没有以前那种”新宅入门必看xxx部作品“一样重视优秀老番的风气了。再有就是湾区亚裔多,可能是日本动漫人气碾压的另一个原因。
那什么作品最热门呢?单从 coser 比例来说,原神 tier 1,电锯人 tier 1.5,其它各种作品的角色都有人出,但比例没法比。祝贺米哈游和中山龙(还有藤本树)
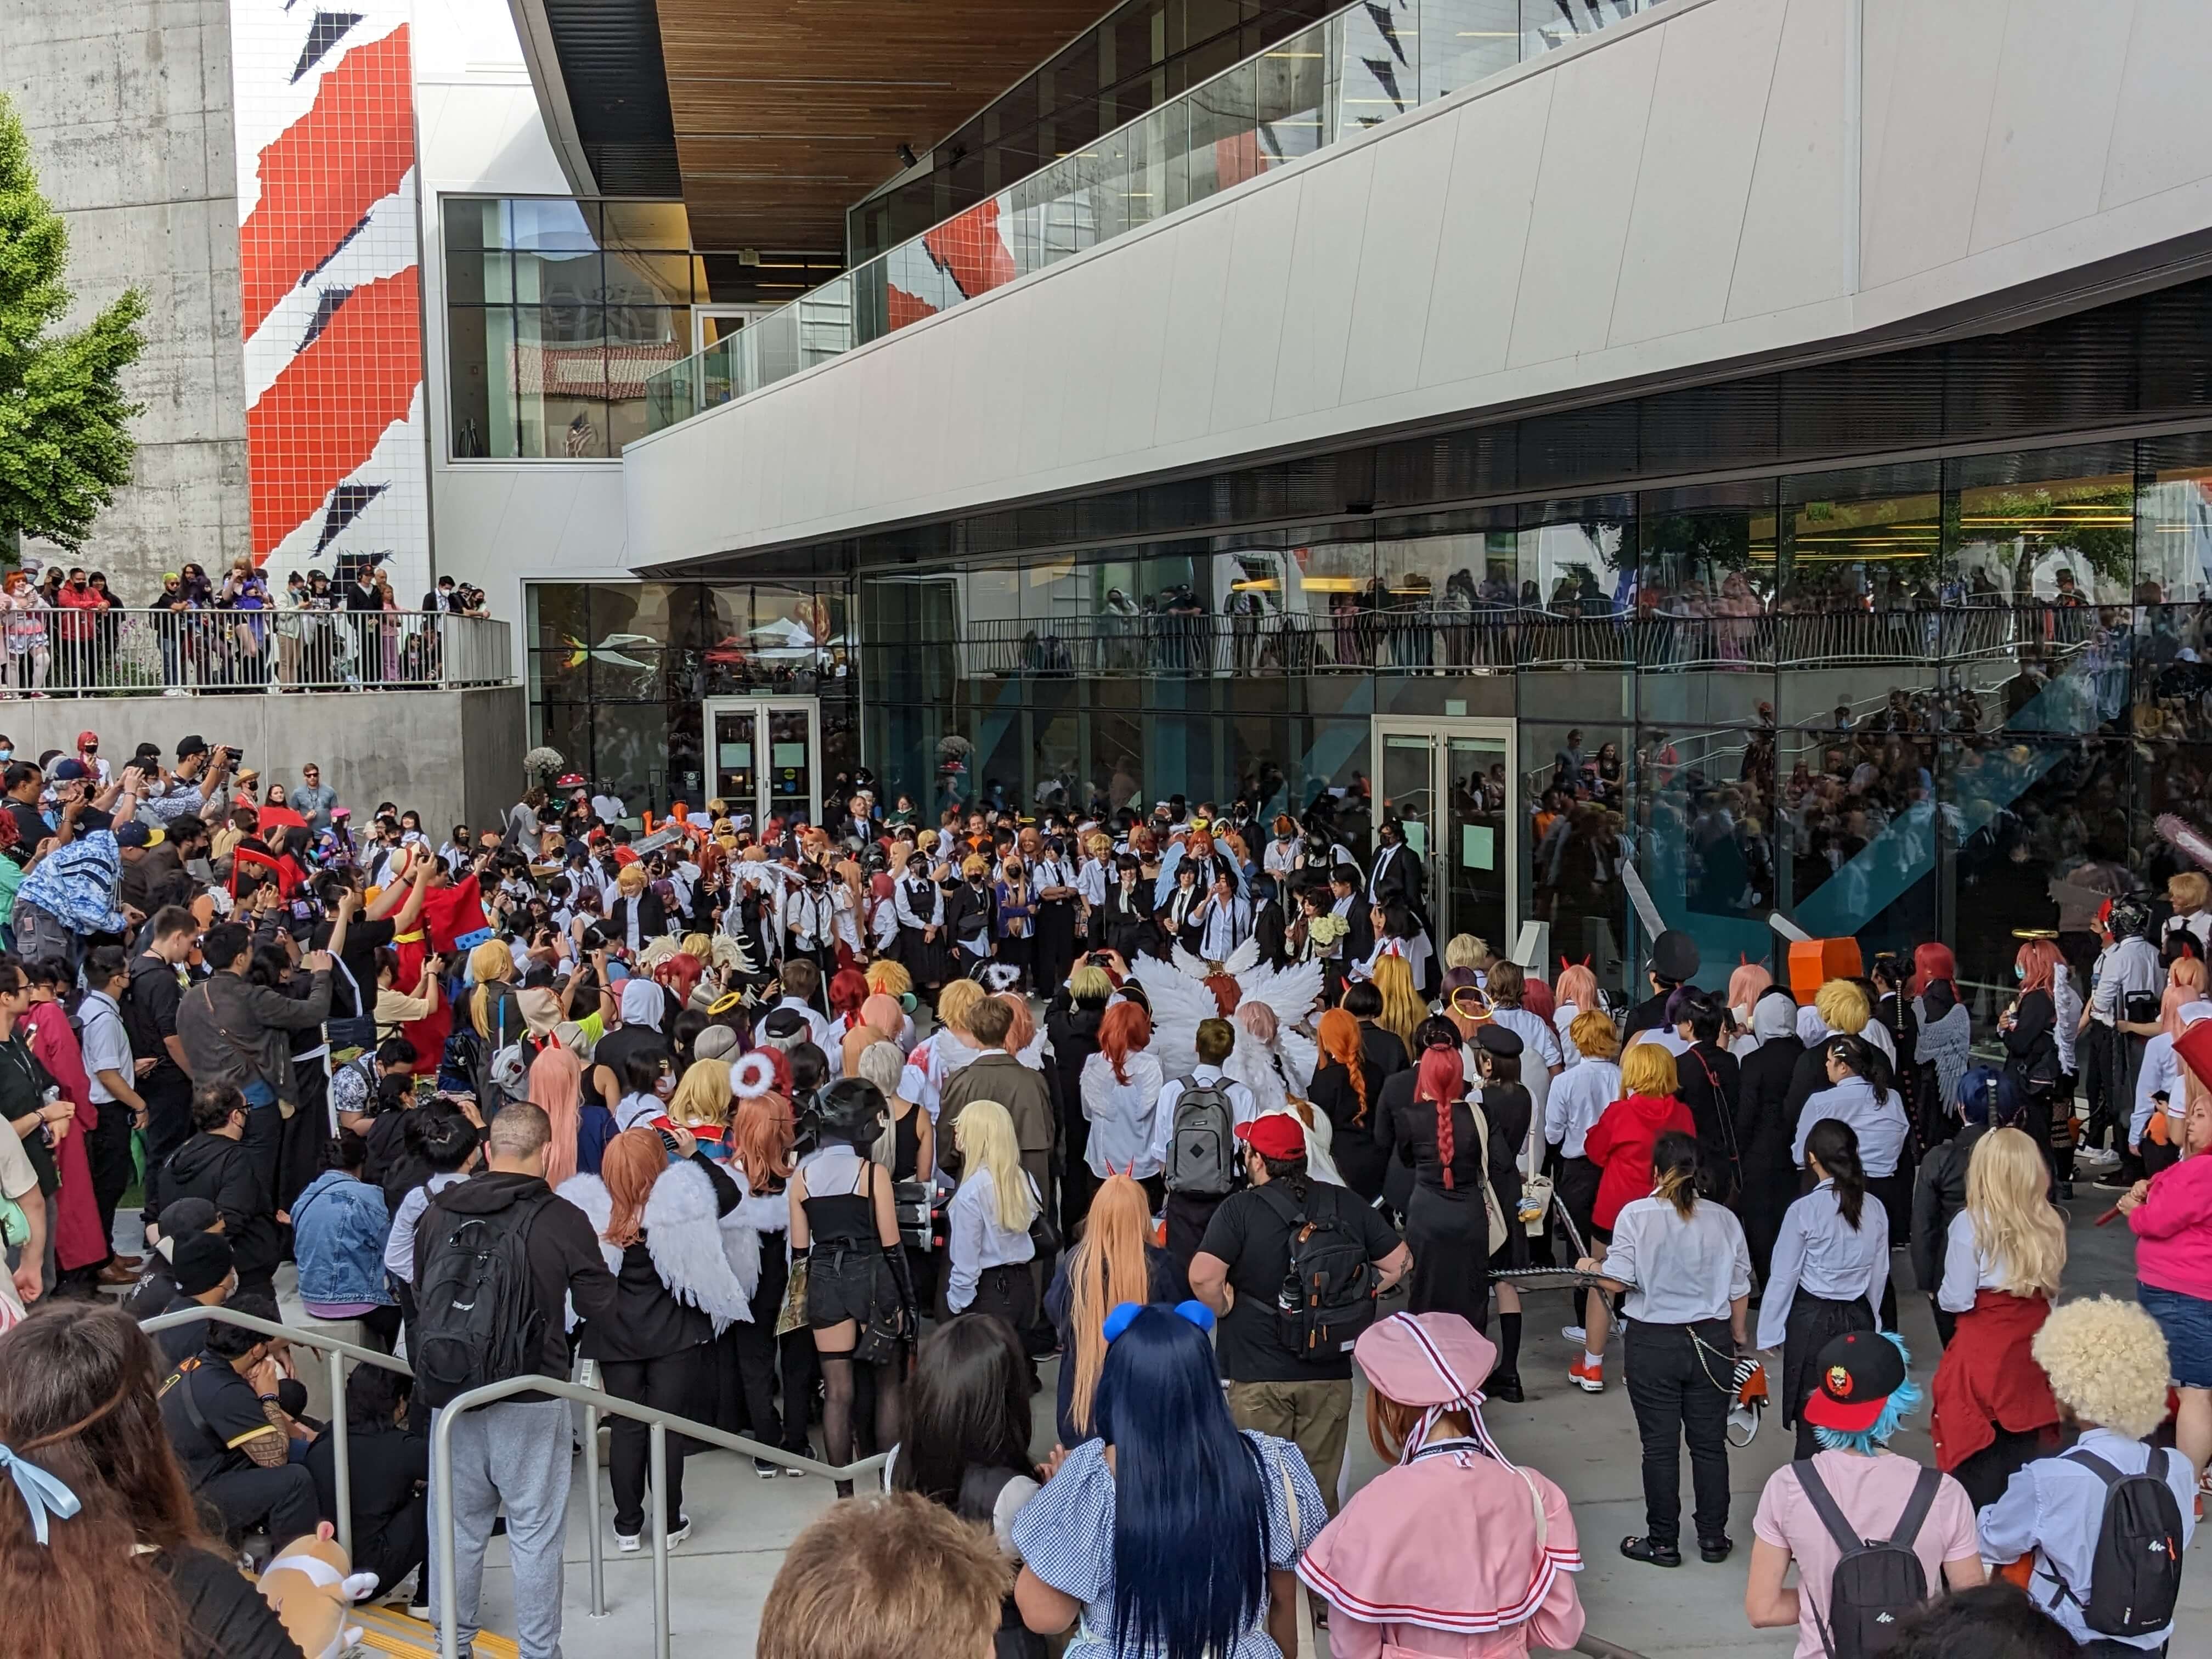
说到 coser,和国内漫展有个很大区别:美国的 coser 巨多,简直人均 coser。可能美国人就是更愿意展示自己吧。然而摄影师是真的少,全场没几台单反,完全见不到国内和日本那种长枪短炮怼着 coser 拍的场景,基本就是路人问 coser 要合影拿手机拍这样。不少还不错的 coser 甚至都没啥人拍,有点可惜。
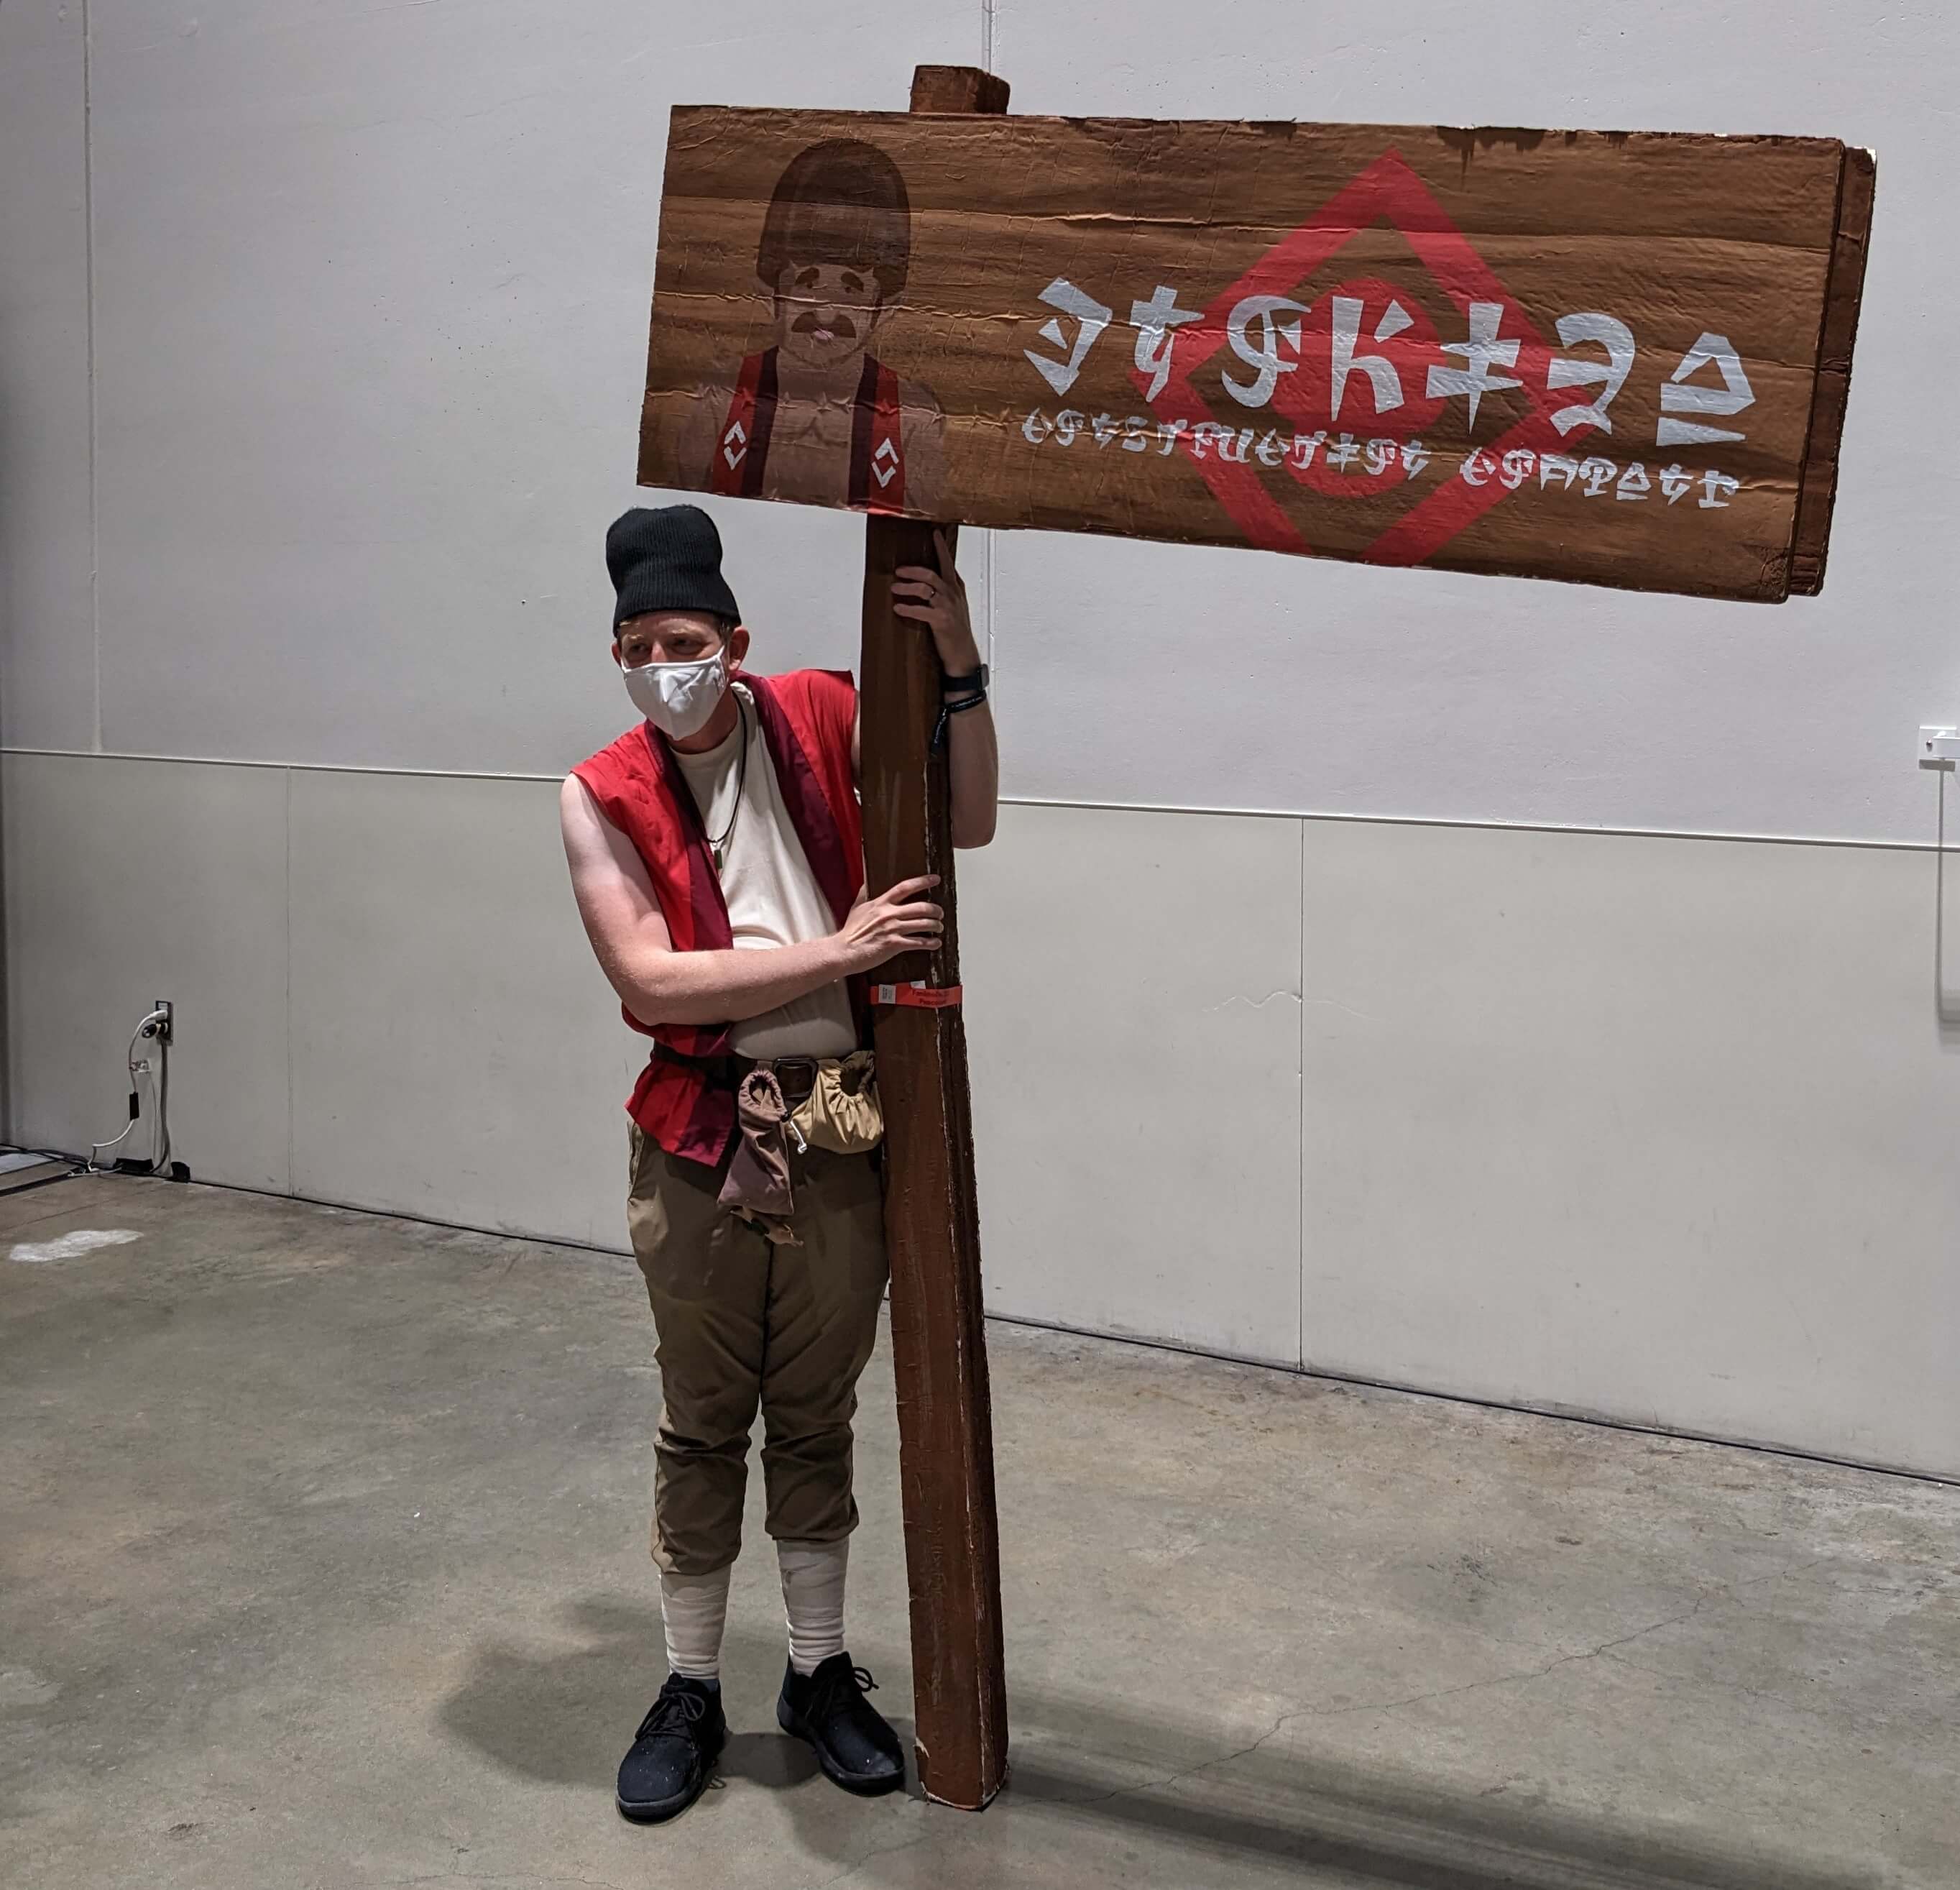
要问哪个 coser 最亮眼,无疑是这位老哥,cos 的是塞尔达王国之泪里的角色。观众如果像游戏里一样帮忙举着让牌子不倒,老哥就会给你一个红色小石头(游戏里的钱)+ 小零食(蘑菇饭团)+ 贴纸(礼物),很有交互感XD。这位 coser 也是刷爆 Twitter。
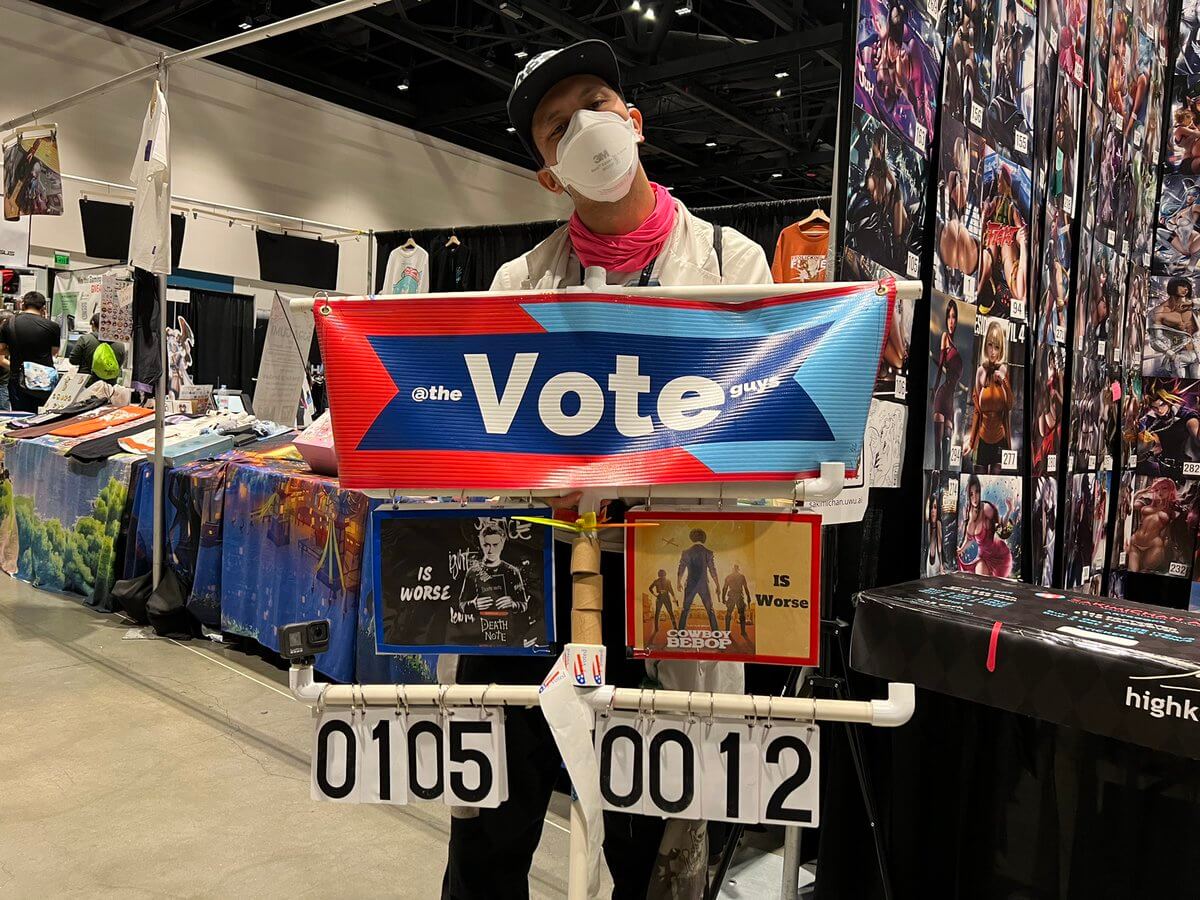
很高兴看到了很多星际牛仔的周边,这都多少年了,美国人看来是真的喜欢。还有一个死亡笔记和星际牛仔真人版哪个最差的投票,笑死我了。星际牛仔真人版我真的觉得还 OK。
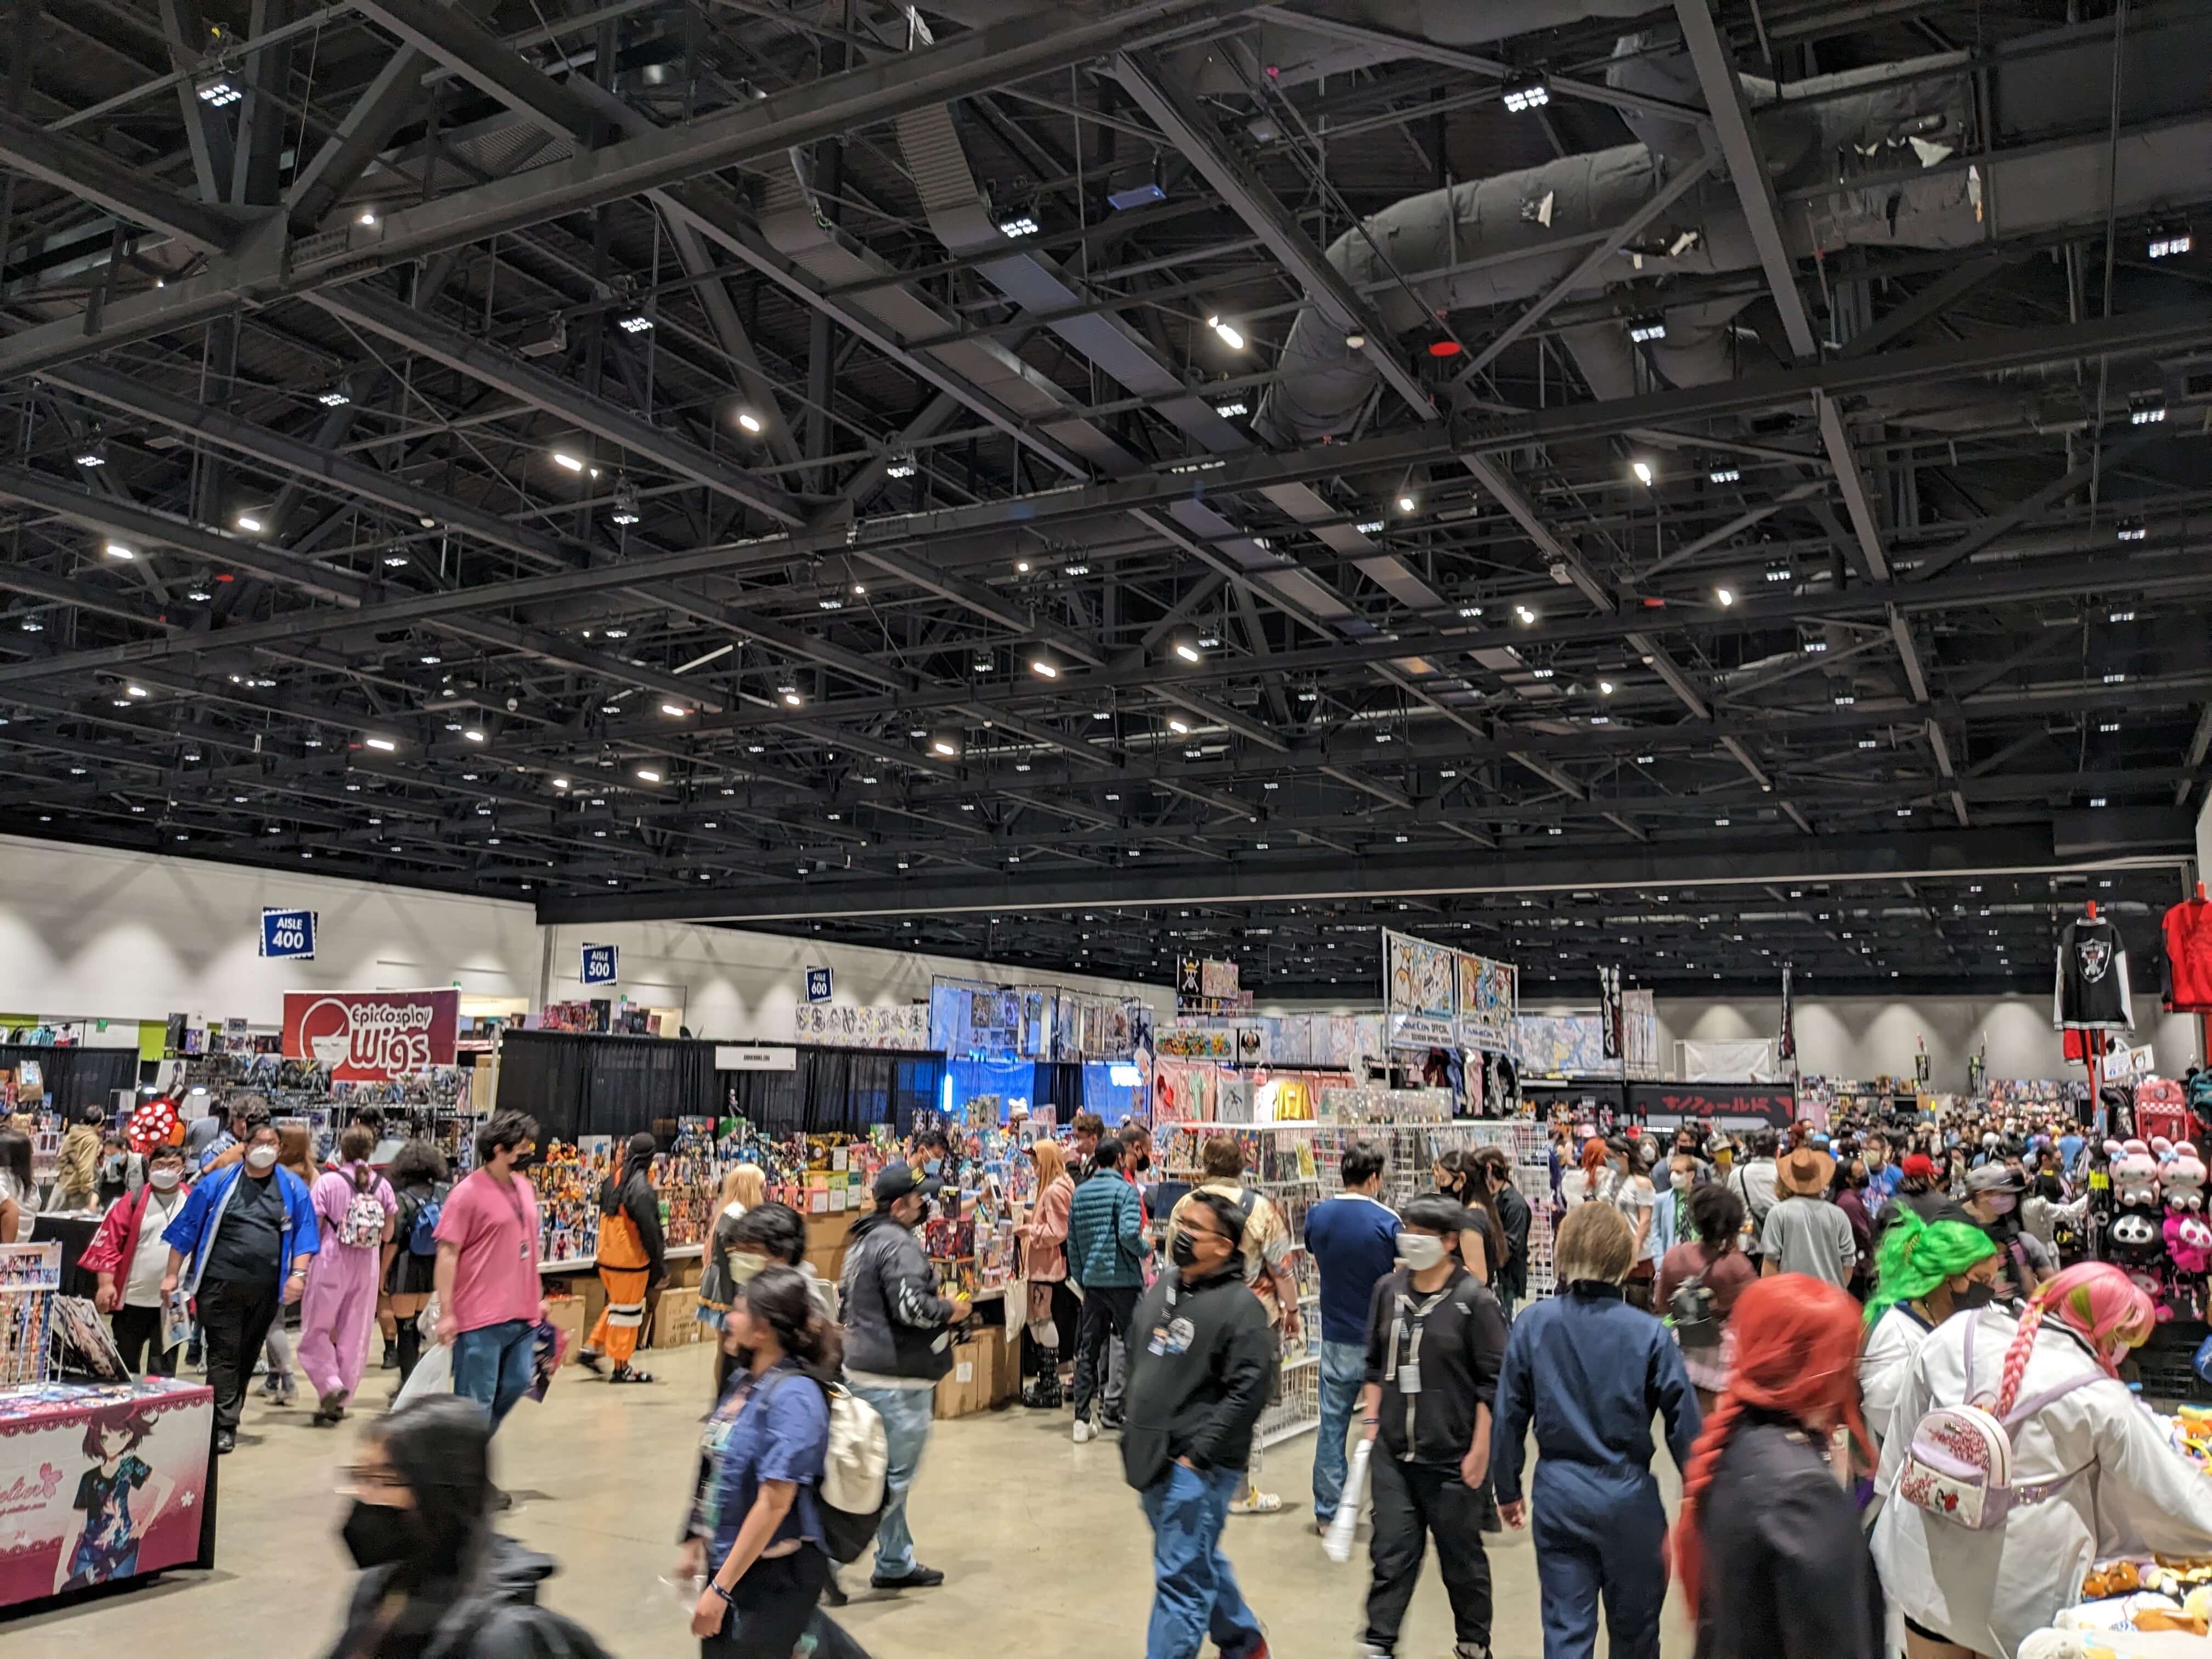
会场是在一个会议中心,主要有几个区域:商品贩售(商家),画师卖画,游戏。商品贩卖区算是中规中矩,并没有很大,见下图:
画师展厅每人有个小摊位,挂满了自己的作品。我也买了一些(后面有照片),逛得还挺爽的。
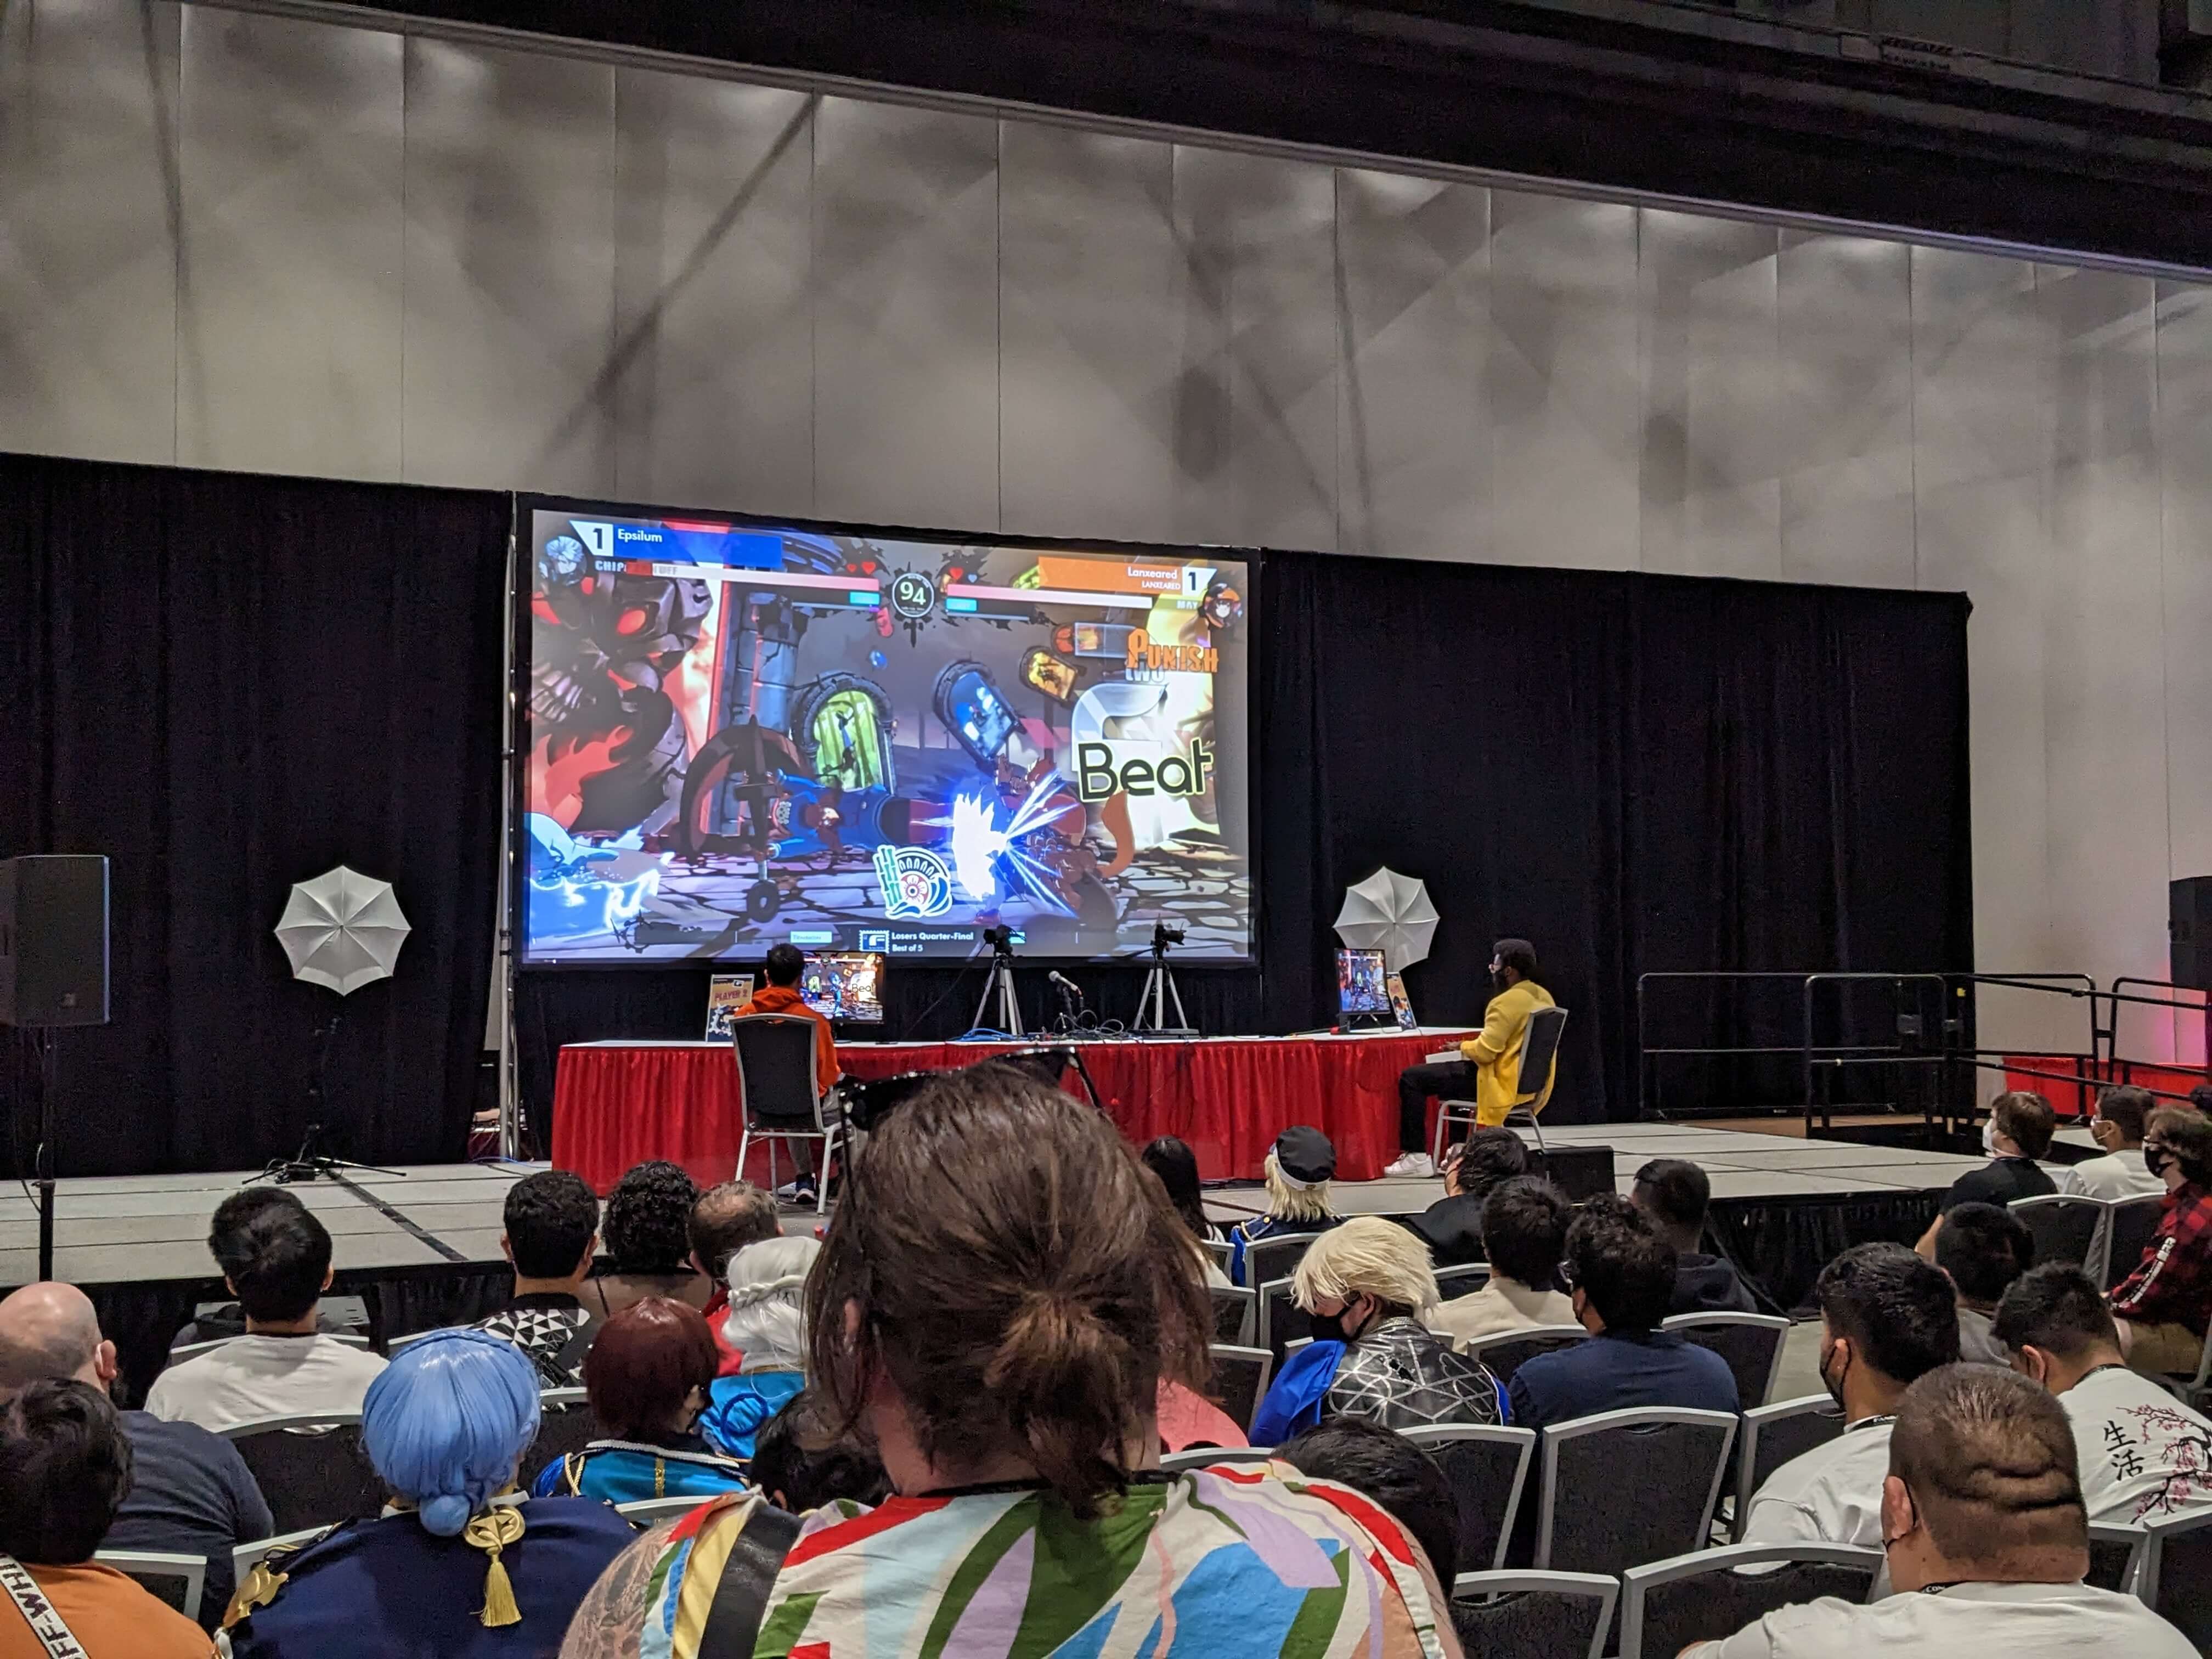
比较有特色的是游戏区,有比赛区、街机区、桌游区、甚至还有一个网吧。很多人在那边玩各种游戏。照了一张罪恶装备的比赛现场。这是我第一次现场看格斗游戏比赛,观众还是非常激动的,当然我完全看不懂:)
还有很多五花八门的活动,我甚至只来得及去一小部分。像什么 coser 比赛,女仆咖啡厅,影片放映我都完全没去,甚至还有 speed dating 和舞会😅。主舞台较小,但也有各种表演(见视频),最后一天下午甚至全是 Kpop,观众可以上去跳。
我去过的会议里(主要是编程相关和漫展),FanimeCon 不论是会场、官网、组织,还是流程都是绝对顶级。可能也只有规模更大的 San Diego Comic-Con 和 Comiket 能超过了吧,但我还没去过这俩。
比较遗憾的是,活动结束后才知道在另外一个会场(需要从主会场搭班车前往)有专门的 R18 主题的展会(Silver Island ),时间也不是白天而是晚上。逛贩售区的时候我还在想美国漫展咋这么保守,没想到竟然在分会场,可以说很有美国特色了。没事,还有明年。
另外两个遗憾
画师展厅有一个玛奇玛的图特别好,只可惜卖完了,还不能预购
见到了 cos 京子 和国夫 的一对 coser,犹豫了一下没拍照。热血少女系列两作我都很喜欢,这种小众作品的 coser 还挺难见到的,真的应该拍一下的。
疫情三年,很多活动要么转线上要么停办,比如 PyCon US/China, PyCascades。后疫情时代第一次参加线下活动,真的是久违了(FanimeCon 要求疫苗证明+全程口罩,想不到吧)。查了一下才知道,FanimeCon 历史非常久,前身可以追溯到 1994 年开始的 Central Valley Anime Expo。明年(2024)是 FanimeCon 三十周年,想必活动规模也会更大,可以好好期待一下。
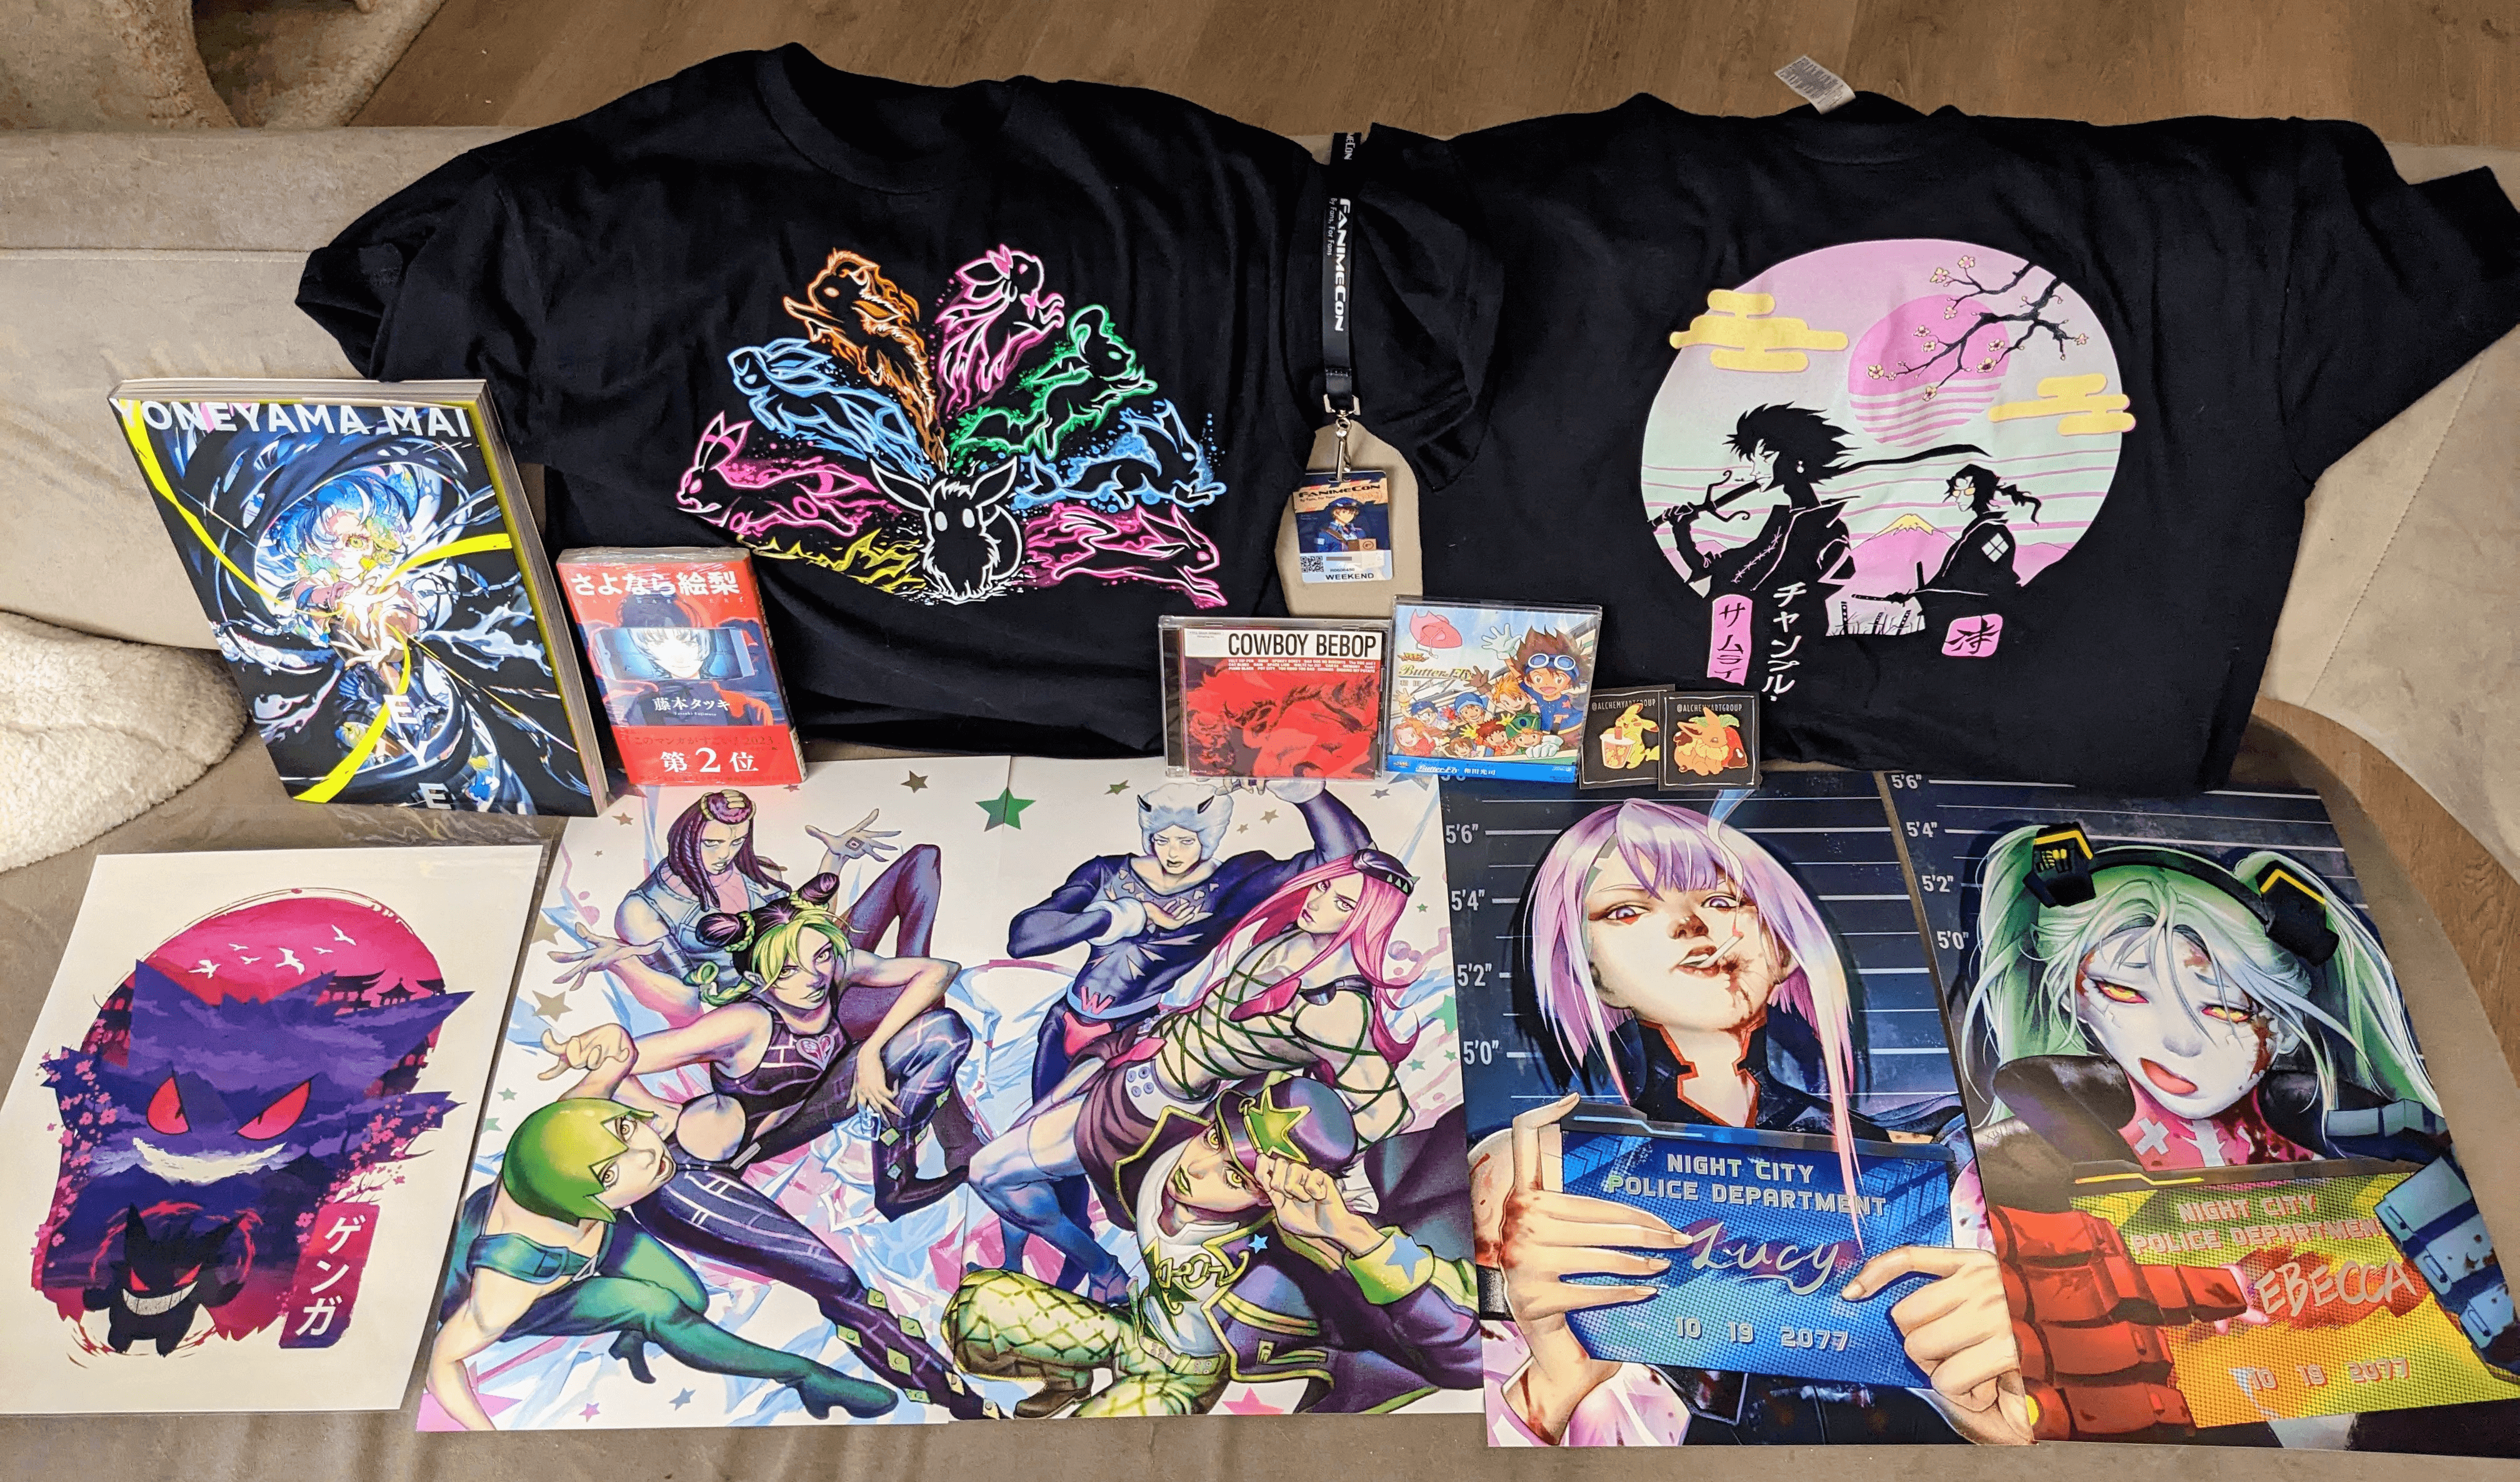
最后的最后,当然是晒一下战利品了,并没有买很多: